Si Surface
Si(111)2x1 surface
The material
- Repeated slab approach: 6 layers of silicon plus 5 a.u. of vacuum region.
- 14 atoms in the cell (50 electrons)
- Plane waves cutoff 6 Hartree (2400 RL vectors)
Introduction
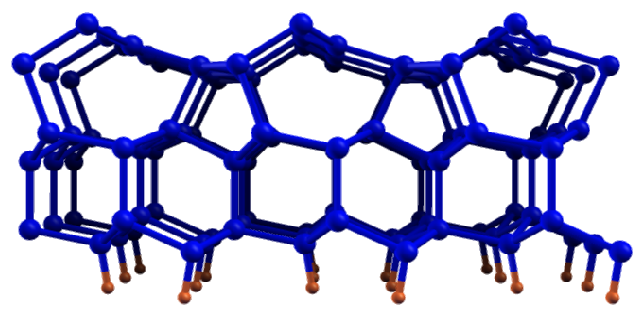
The Si(111)2x1 surface is characterized by the famous Pandey reconstruction [1], done by bonded chains of Silicon atoms along the [01-1] direction
Large blue spheres represent Si atoms; small red spheres are hydrogen atoms used to saturate the dangling bonds. On the bottom the ideally terminated surface.
The electronic band-structure
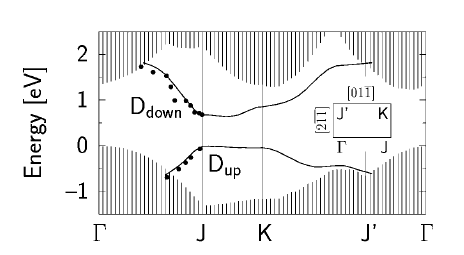
Electronic band structure of the Si(111) 2x1 surface from [2] The shaded areas denote Si bulk states. The continuous lines indicate the dispersion along the high-symmetry directions of the Brillouin Zone of the occupied and unoccupied surface states, which are the states involved in the optical peak observed at about 0.45 eV. The dots are experiments.
and the optical properties
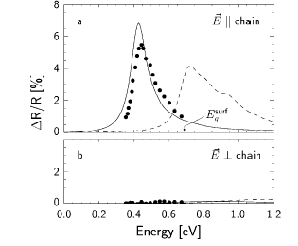
Differential reflectivity theoretical spectrum of the Si(111)2x1 surface, compared with experiments (dots) [2]. The dashed curve is the theoretical spectrum obtained at the RPA-GW level, while the solid curve is obtained solving the BSE equation, with the inclusion of self-energy, local-fields and electron-hole interaction. Top panel for light polarized along the Pandey chains, bottom panel for light polarized perpendicular to them. See [2] for details.
Within first-principles, using the GW method and the BSE approaches, have been calculated in the past years [2] and explain the experimental optical peak observed in the experiments [3] at about 0.45 eV, as due to a surface-states exciton, bound about 0.25 eV. From an historical point of view, it is interesting to mention that its measurement was one of the first experimental proofs of the existence of surface states in semiconductor surfaces. Before starting with the calculations let us say few words about the experimental data we wish to compare with. The optical data reported in the previous figure, have been obtained using a Surface Differential Reflectance (SDR) technique. In this optical spectroscopy the reflectance of the clean surface is measured first, and then that of the surface after chemisorption of some adsorbate (generally hydrogen or oxygen); the difference, the SDR, a few percent of the reflectance, surely originates at the surface. The use of this optical spectroscopy or other ones, such as the Reflectance Anisotropy Spectroscopy (see ref. [4] for an extended discussion), is required to make the optical probe, due to its large penetration, sensitive to the surface region. This means that, in order to compare properly with the experiments, we should calculate the reflectance for the clean and the covered Silicon surface following the formulas given, for instance, in ref [4]. Nevertheless, in the present case, the SDR signal at about 0.45 eV, (present only for light polarized along the Pandey chains, top panel), is actually proportional to the polarizability of the clean surface. For this reason, in the present tutorial, we will limit to calculate only the slab polarizability, for light polarized along the Pandey chains and perpendicular to them, and we will compare the first one with the experimental SDR peak, simply rescaling its intensity.
In order to simulate the surface/vacuum system the repeated slab approach is used. In the present simulation we have: an atomic slab of 6 layers of Silicon (with one of the surfaces presenting the Pandey reconstruction, while the other one has an ideal termination, with the Silicon dangling bonds saturated by Hydrogen atoms) and a vacuum region of about 5 a.u., in order to eliminate the spurious interactions among the images in the different cells; a uniform bi-dimensional mesh of 13 k-points in the IBZ.
It is important to underline that the atomic slab and vacuum thickness, k-point mesh, and kinetic energy energy cut-off (only 6 Hartree) are not appropriate for a well converged calculation, but have been chose, here, to speed up the simulations.
Initialization (yambo -i -V RL)
To run this example enter the 2D_Si_surface/yambo directory and type
localhost:>yambo -F Inputs/01_init
Note the use of only 1000 RL components instead of the 2400 available from the DFT charge
MaxGvecs=1000 # (INI) Max number of G-vectors planned to use
Random-Phase approximation
The easiest way of calculating the slab polarizability tensor (here we will calculate only the two needed components, for light polarized along the Pandey chains and perpendicular to them) is to use the Independent Particle Approximation (IPA) and the [[../../theory/docs/doc_Xd.php#RPA|Random Phase Approximation]] (RPA). The Inputs/02_RPA_no_LF_par and Inputs/02_RPA_no_LF_perp are the inputs for simple IPA response function calculations (without the inclusion of Local Field Effects (LFE)), for light polarized along
% LongDrXd
0.000000 | 1.000000 | 0.000000 |      # [Xd] [cc] Electric Field
%
and perpendicular to the Pandey chains
% LongDrXd
 1.000000 | 0.000000 | 0.000000 |      # [Xd] [cc] Electric Field
%
with
NGsBlkXd=1 RL # (Xd) Response block size
To run these two examples, type:
localhost:>yambo -F Inputs/02_RPA_no_LF_par -J 02_RPA_no_LF_par
localhost:>yambo -F Inputs/02_RPA_no_LF_perp -J 02_RPA_no_LF_perp
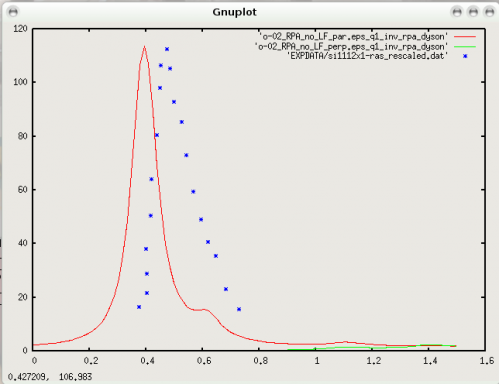
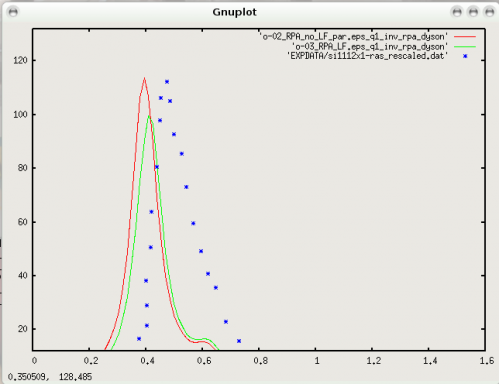
After running, we should compare the obtained theoretical curves with the experiments. The comparison looks like:
you can see, already at the simple RPA level, evidence of the strong anisotropy of the optical peak due to surface-surface states transitions, which is completely polarized along the Pandey chains. We can note that, since we are neglecting the many-body effects, the energetic position of the optical peak (for light polarized along the Pandey chains) is not in good agreement with the experiments. Furthermore it is important to underline that actually the disagreement increases, performing a well converged RPA calculation (denser k-points mesh, higher kinetic energy cut-off,thicker slab).
By using the Hartree kernel, we include local fields and observe their effects for the polarizability for light polarized along the Pandey chains. In practice this corresponds to include more G-components in the response function by using the variable NGsBlkXd. In Inputs/03_RPA_LF_par the response function size is changed to 50 RL. The converged value for NGsBlkXd must be found doing several calculations with different values and checking the effect on the final spectrum. After running, you should obtain the following curves:
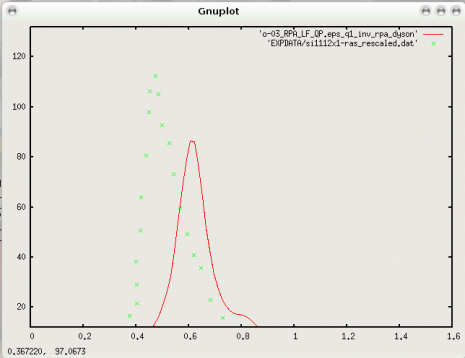
Again the comparison with the experiment clearly show that the LF effects are not enough to have a good agreement with the experiments. The onset position can be artificially corrected using a QP gap correction of 0.2 eV that simply opens rigidly the LDA gap. This is done in Inputs/03_RPA_LF_QP with the line
% XfnQP_E
 0.20000 | 1.000000 | 1.000000 |      # [EXTQP Xd] E parameters (c/v)
%
and the corresponding result looks like:
Adiabatic LDA approximation in real-space (yambo -o b -k alda -y hd -V resp)
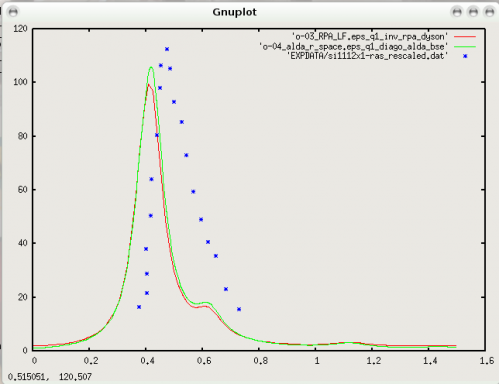
Again the first attempt to go beyond RPA is to use the TDDFT in the Adiabatic LDA approximation.
The input file Inputs/04_alda_r_space, at difference with the bulk LiF case, uses the Bloch representation of the TDDFT equation. In this case yambo uses the Bethe-Salpeter equation with a modified exchange part that includes the ALDA kernel.
To run this example, type:
localhost:>yambo -F Inputs/04_alda_r_space -J 04_alda_r_space
After running, we can compare again the theory and the experiment and see that ALDA gives only slightly changes to the RPA result.
The Statically screened Electron-electron interaction(yambo -b)
As we have seen, in other sections of this tutorial, the calculation of the statically screened Electron-electron interaction is required in order to perform a Bethe-Salpeter calculation. To perform this calculation, type:
localhost:>yambo -F Inputs/05_W
The screened interaction matrix will be written at the end of this run in the database SAVE/ndb.em1s. It is important to underline that, also at this level of the calculation, careful convergence tests in the plane-wave components and the electronic transitions involved in the screened coulomb interaction matrix, should be, in principle, required.
Bethe-Salpeter equation (yambo -o b -k sex -y hd -V qp)
We are now ready for a BSE calculation, the hope is to obtain now, with the inclusion of the excitonic effects, an optical spectrum (for light polarized along the Pandey chains) which can compare well with the experiments. To see what happens, type:
localhost:>yambo -F Inputs/06_BSE -J 06_BSE
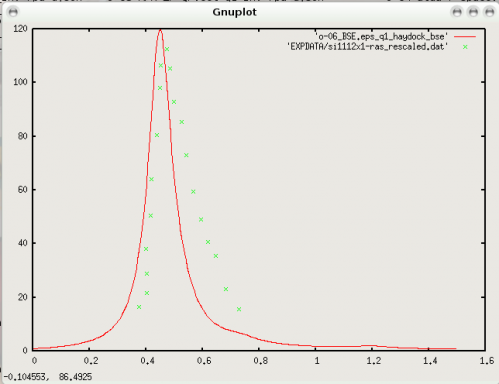 We can see that the BS equation is, also in this case, able to give a theoretical optical spectrum in nice agreement with the experiments, describing the bound electron-hole state responsible for the peak observed experimentally below the QP gap (see Fig.2 from ref. [2], for well converged GW and BSE calculations). This surface-states exciton is clearly much less bound that in the case of the LiF, but we have to consider that Silicon is a small gap semiconductor and actually the corresponding binding energy in the bulk Silicon is completely negligible.
A Bethe-Salpeter based Fxc(yambo -o c -k lrc)
As in the case of LiF, you can try, also in this surface, a simple Long Range Component model, as introduced in Reining using the input file Inputs/07_LRC where
LRC_alpha= -0.280000 # [TDDFT] LRC alpha factor
The resulting optical spectra, compared with BSE curve, are the following:
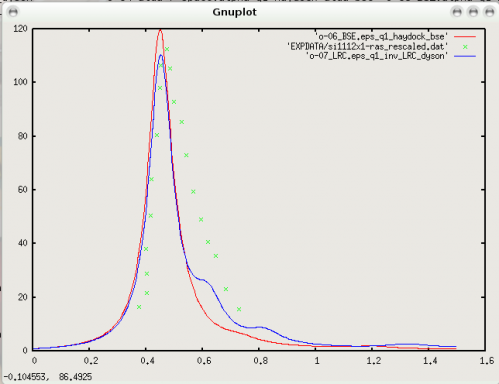 We see from this last figure that (at least for this low energy optical peak of the Si(111)2x1 surface) the agreement with the BS calculation is actually very good, and the simple Long Range Component model properly describes this bound exciton.
Additional Exercises
- Calculate the polarizability including local fields effects for light polarized perpendicular to the Pandey chains.
- Repeat the calculations of the polarizability spectra of section 02-03 using the Bloch representation of TDDFT (yambo -o b -k alda -y d).
- Repeat the ALDA, BSE, and LRC calculations for light polarized perpendicular to the Pandey chains.
References
- K.C. Pandey, Phys. Rev. Lett. 49, 223 (1982).
- M. Rohlfing, S. Louie, Phys. Rev. Lett. 83, 856 (1999).
- P. Chiaradia et. al., Phys. Rev. Lett. 52, 1145 (1984); Phys. Rev. Lett. 56, 2411 (1986).
- R. Del Sole, Reflectance spectroscopy-theory in Photonic probes of surfaces, edited by P.Halevi (Elsevier, Amsterdam 1995), p.131, and references therein.
