Difference between revisions of "Bethe-Salpeter solver: diagonalization"
| Line 16: | Line 16: | ||
[[File:BSE1-Eq4.png|none|x50px]] | [[File:BSE1-Eq4.png|none|x50px]] | ||
To get the two-particle Hamiltonian eigensolutions you | To get the two-particle Hamiltonian eigensolutions you need to diagonalize the two-particle Hamiltonian: | ||
[[File:BSE1-Eq1.png|none|x50px]] | [[File:BSE1-Eq1.png|none|x50px]] | ||
Revision as of 22:06, 16 April 2017
In this module you learn how to obtain an optical absorption spectra within the Bethe-Salpeter equation (BSE) framework by diagonalizing a previously calculated Bethe-Salpeter (BS) kernel.
Prerequisites
- You must first complete the Static screening and Bethe-Salpeter kernel modules
You will need:
- The
SAVEdatabases for 3D hBN - The
3D_BSEdirectory containing the databases from the Static screening and Bethe-Salpeter kernel modules - The
yamboexecutable gnuplotfor plotting spectra
Background
The macroscopic dielectric function (from which the absorption and EEL spectra can be computed) is obtained from the eigenvalues Eλ (excitonic energies) and eigenvectors Aλcvk (exciton composition in terms of electron-hole pairs) of the two-particle Hamiltonian:
To get the two-particle Hamiltonian eigensolutions you need to diagonalize the two-particle Hamiltonian:
which was evaluated in the Bethe-Salpeter kernel module.
Choosing the input parameters
Invoke yambo with the "-y d" option in the command line:
$ yambo -y d -F 03_3D_BSE_diago_solver.in
The input is open in the editor. The input variable to be changed are
% BEnRange
  2.00000 | 8.00000 | eV
%
BEnSteps= 200
which define 200 evenly spaced points between 2 and 8 eV at which the spectrum is calculated (ω in the equation for the macroscopic dielectric function),
% BDmRange
  0.10000 |  0.10000 | eV
%
which defines the spectral broadening (Lorentzian model),
% BLongDir
 1.000000 | 1.000000 | 0.000000 |
%
which defines the direction of the perturbing electric field (in this case the in-plane direction).
Bethe-Salpeter solver runlevel
$ yambo -F 03_3D_BSE_diago_solver.in -J 3D_BSE
In the log (either in standard output or in l-3d_BSE_optics_bse_bsk_bss), after various setup/loading, the BSE is diagonalized using the linked linear algebra libraries:
<01s> [06] BSE solver(s)
<01s> [LA] SERIAL linear algebra
<01s> [06.01] Diagonalization solver
<01s> BSK diagonalize |########################################| [100%] --(E) --(X)
<01s> EPS   residuals |########################################| [100%] --(E) --(X)
<01s> BSK     epsilon |########################################| [100%] --(E) --(X)
The report r-3d_BSE_optics_bse_bsk_bss contains information relative to this runlevel in section 6:
[06] BSE solver(s)
==================
Take some time to inspect the log and the report to check the consistency with the input variables. This run produces a new database in the 3D_BSE directory
3D_BSE/ndb.BS_diago_Q01
So if you need the spectrum on a different energy range, direction, with a different broadening or on more points the diagonalization is not repeated, just the spectrum is recalculated.
This run produces as well human readable files (o-*). Specifically o-3D_BSE.eps_q1_diago_bse contains the real and imaginary part of the macroscopic dielectric function
$ less o-3D_BSE.eps_q1_diago_bse
...
#
#  E/ev[1]    EPS-Im[2]  EPS-Re[3]  EPSo-Im[4] EPSo-Re[5]
#
  2.00000    0.16162    5.83681    0.04959    4.14127
  2.03015    0.16787    5.88612    0.05090    4.15638
...
which is in the format
Energy in eV | Imaginary part BSE | Real part BSE |Imaginary part IPA | Real part IPA |
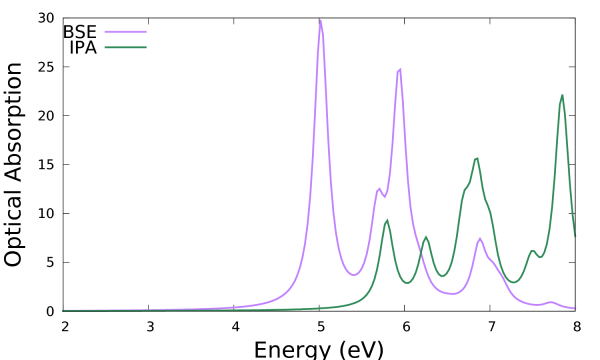
where real and imaginary parts refer to the macroscopic dielectric function. The imaginary part corresponds to the optical absorption. The latter (column 2) can be plotted versus the photon energy (column 1) and compared with the independent particle approximation (IPA, column 4), e.g.:
$ gnuplot
...
plot 'o-3D_BSE.eps_q1_diago_bse' u 1:2 w l t 'BSE', 'o-3D_BSE.eps_q1_diago_bse' u 1:4 w l  t 'IPA'
The addition of the kernel has the effect to red-shift the spectrum onset and to redistribute the oscillator strengths. Note that the convergence with respect to k-points smooths out the low energy peaks in the IPA (which are an artifact of poor convergence with k-points producing an artificial confinement) to give the shoulder corresponding to the van Hove singularity in the band structure. On the other hand the low energy peak in the BSE is genuine and it is the signature of a bound exciton.

