Phonon-assisted luminescence by finite atomic displacements
In recent years, several articles have been published with Yambo, who calculated the phonon-assisted luminescence by means of finite atomic displacements[1][2][3][4][5].
In this tutorial, we will show how to use YamboPy in combination with Yambo to perform this kind of calculation. For a general review of finite displacement calculations of vibrational properties we recommend this article[6].
Notice that the calculation of phonon-assisted luminescence by finite atomic displacements are quite involved and expensive from a computational point of view, for this reason, they are limited to relatively simple systems.
In this tutorial, we will follow the approach of Ref.[2], and calculate luminescence using the Roosbroeck–Shockley (RS) relation applied to the excitonic case.
If you use this approach to calculate luminescence or phonon-assisted absorption please cite references [1] and [2].
Important: This tutorial requires that you are familiar with Bethe-Salpeter calculations with Yambo, and phonons with Quantum-Espresso, and YamboPy. If it is not the case please study the corresponding tutorial before continuing.
Locate the lowest indirect exciton (or indirect band gap)
In this tutorial as example, we will consider the hexagonal-BN, which is an indirect insulator. The first step to calculate the phonon-assisted luminescence is to locate the lowest indirect exciton. The cleanest strategy to identify the lowest excitation would be to calculate the excitons along the whole Irreducible Brillouin zone(IBZ), then interpolate them as explained in Interpolate exciton dispersion and find the q point that corresponds to the minimum.
A simpler approach is to use the GW (or Kohn-Sham) band structure to find the momentum responsible for the indirect band gap, in the major part of cases this corresponds to the lowest exciton.
In the h-BN case we have:
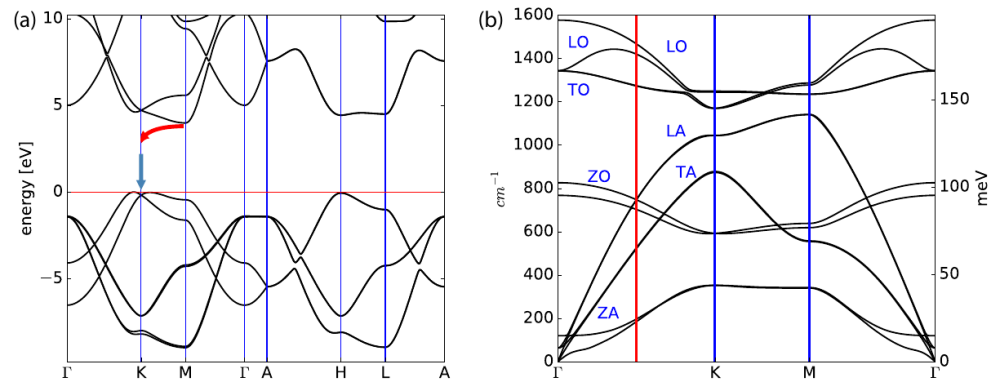
The indirect gap is between a point close to K and the M point, see panel (a) of the figure above. We will approximate the momentum responsible for the indirect emission with q=K-M. Notice that then we should build supercells that contain this moment, so it is good to approximate it with fractions of integers that are not too large so as not to have giant supercells. In this case we get q=(1/3,-1/6, 0).
Notice that if you have a direct band gap material, the momentum q corresponding to the lowest transition is q=0 and you do not need to construct special supercells to sample the corresponding vibration, it will be sufficient to displace atoms in the primitive cell.
Calculate phonons at momentum q of the indirect transition
Now we need to calculate all atomic vibrations compatible with the momentum of the lowest indirect transition. In order to do so, we first calculate the phonons with QE, here the inputs hBN_phonons.tgz, then we calculate the force constants with q2r.x and now we can interpolate phonons along all the BZ as shown in panel (b) of Figure 1. Then we use matdyn.x to calculate phonons at momentum q=K-M = (1/3, -1/6, 0):
&input
   asr='crystal',
   flfrc='bn.fc',
   flfrq='bn.freq',
   deltaE=1.d0,
   q_in_cryst_coord=.true.
   fleig='bn.eig'
/
2
0 0 0
0.3333333333333333 -0.16666666666666666666 0.0
The obtained phonon modes correspond to phonons at the vertical red line in panel(b) of Fig. 1. They are written in the matdyn.modes file with the corresponding eigenvectors and will be later used to displace atoms along the phonon modes. If you open the 'matdyn.modes' file you will find phonon modes for the q=0 and q=(1/3, -1/6, 0) that in cartesian coordinates is (1/3,0,0). We copy the modes corresponding to the second q=(1/3, -1/6, 0) in a separate file, called Q2.modes that will look like:
     diagonalizing the dynamical matrix ...

q =       0.3333      0.0000      0.0000
**************************************************************************
    freq (    1) =       5.194139 [THz] =     173.257815 [cm-1]
(  0.000000  -0.000000    -0.000000  -0.000000    -0.274372  -0.475224   )
( -0.000000   0.000000    -0.000000  -0.000000    -0.445962   0.000001   )
( -0.000000  -0.000000    -0.000000  -0.000000    -0.222981  -0.386214   )
(  0.000000   0.000000    -0.000000   0.000000    -0.548742   0.000000   )
...........................
Generate the supercell
Now we use YamboPy to generate the supercell corresponding to the momentum q=(1/3, -1/6, 0). A tutorial is already present in the file tutorial/supercell/generate_supercells.py. You can edit the file to specify the momentum q, the name of the SCF initial file (uc_filnm), and the name of the phonon mode file (mode_file).
   .....
   uc_filnm = 'hBN.scf.in' #pw input
   Q = [[1,-1,0],[3,6,0]] #qpoint to fold in nondiagonal supercell: Q=(1/3,-1/6,0)
   kpoints = [12,12,4]    #NB: these fractional crystal coordinates must exactly divide the kpoint mesh!
   modes_file = 'Q2.modes' #file with phonon eigenmodes
   .....
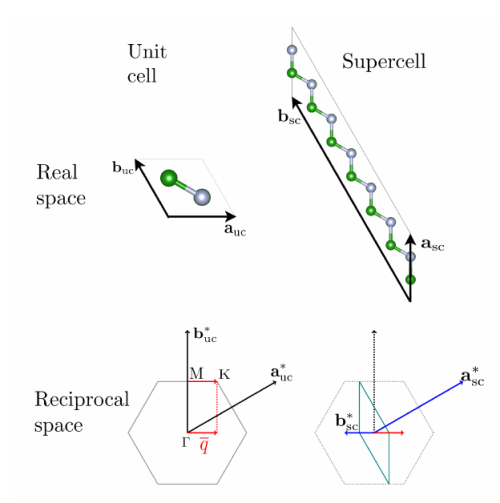
run the script to generate the supercell without displacing atoms python generate_supercells.py -N. The script will generate a non-diagonal supercell[7] in the file "sc_nondiagonal.bn.scf' that is shown below:
The YamboPy script automatically reduces the number of k-point in such a way to have the same sampling of the corresponding primitive cell, however we advise you to check if the new k-point grid is what you expect, and modify it in case of the incorrect grid.
In the same way, you can generate the input file for non-self-consistent calculation in the supercell.
Calculate the optical spectra in the supercell
Now you have to calculate the optical spectra and exciton in the new supercell. Do not forget to increase the number of conduction bands in both the screening and the Bethe-Salpeter equation. For example in the supercell shown above, there are 24 atoms, 6 times more than in the original cell, so you will have to multiply the number of bands by 6, if in the base cell you have used 40 bands here you will have to put 240 to have the same convergence parameters. Then print exciton according to their energy with the command ypp -e s.
N. B. : in order to not recalculate W for each atomic displacement you can perform calculations without symmetries in the pristine supercell and then copy the corresponding dielectric constant in the calculations with displaced atoms, this is usually a safe approximation described in Ref.[1].
After solving the BSE in the supercell you will find the excitons that were already present in the primary cell (within the numerical noise) and new lower energy excitons, with zero dipole matrix elements, that correspond to the indirect excitons that have now been mapped at q=0, something like:
#    Maximum Residual Value =  0.38659E+01
#
#    E [ev]             Strength           Index
#
    5.7165937         0.47290171E-11      1.0000000         <-- Indirect exciton mapped at q=0
    5.7166047         0.58239158E-09      2.0000000         <-- Indirect exciton mapped at q=0
    5.7367945         0.31830746E-09      3.0000000         <-- Indirect exciton mapped at q=0
    5.7368207         0.33674005E-10      4.0000000         <-- Indirect exciton mapped at q=0
    5.80542803        0.100763231E-6      5.00000000        <-- Direct exciton
    5.80598068        0.384604526E-8      6.00000000        <-- Direct exciton
    5.88944197         1.00000000         7.00000000        <-- Direct exciton
    5.88967037        0.102969212E-1      8.00000000        <-- Direct exciton
    ................
This result shows that indirect exciton without the coupling with phonon does not contribute to the optical response.
Displace atoms and calculate dipoles derivatives
Now you can generate the displaced supercell for all the phonon modes compatible with the indirect band gap q point by doing: python generate_supercells.py -S. The script will produce a set of input files for each of the 12 phonon modes at q=(1/3,-1/6,0). You have to perform BSE calculation for each one of these modes and get exciton dipoles.
For each phonon mode the atoms are displaced along the corresponding eigenvector read from the "Q2.modes" file multiplied for 0.1 Bohr (the variable Temp=0.1), see the following line in "generate_supercell.py":
 ...
 sc.displace(eivs,nd_atom_positions,Temp=0.1) # Generate list of displaced supercells as PwIn objects called 'modes_qe'
 ...
this is usually a good value to get correct derivatives. In principle, it is possible to test different displacement lengths to get good second derivatives. The general rule is that the displacement should not be too small to avoid numerical noise and not too large to avoid contribution from third or forth order derivatives.
Once you get dipoles for a given phonon mode you can calculate the second order dipole derivatives using a finite difference formula and the fact the first order derivatives are zero by construction as:
[math]\displaystyle{ \frac{\partial^2 | T^S |^2}{\partial R_{\lambda,q}^2 } = 2 \frac{| T^S (R=\Delta R) |^2 - | T (R=0) |^2}{\Delta R^2} = 2 \frac{| T^S (R=\Delta R) |^2}{\Delta R^2} }[/math]
In the Ref.[2][3] we found that a single point formula above is enough to get good second derivatives, taking into account that the first derivative is zero, however you can test higher-order formulas to be sure that the result is correct, see for example higher-order differences
Important: in the file produced by ypp the oscillator strengths are normalized to have the maximum equal to one, before calculating the derivatives remember to remove this normalization by multiplying all Oscillator Strengths for the maximum residual value, in the previous example:
# Maximum Residual Value = 0.38659E+01
Luminescence
Now you have all the information necessary to construct the emission spectra.
Using the formula, derived in Ref.[2] you obtain the phonon-assisted luminescence as:
in this formula:
- nr(ω) is the refractive index, that usually can be approximated with a constant in the luminescence energy range.
- ESq are the excitonic energies in the undistorted supercell, including indirect excitons
- B(ES,Texc) is the Bose occupation of excitons, that can be approximated with a Boltzman function, see Ref.[2][3]
- Texc is the excitonic temperature that should be obtained from experimental measurements or used as a parameters, for a discussion see Ref.[2]
- d2|TS|2/dR2λq are the derivatives of the exciton dipole matrix elements for a given phonon mode
- Ωλ,q are the phonon frequencies and the sum on q is on the different supercells obtained from phonon modes responsible for the luminescence, in this tutorial there is just a single q point.
- η is the exciton line-width that is given as input parameter to define the broadening of the spectra
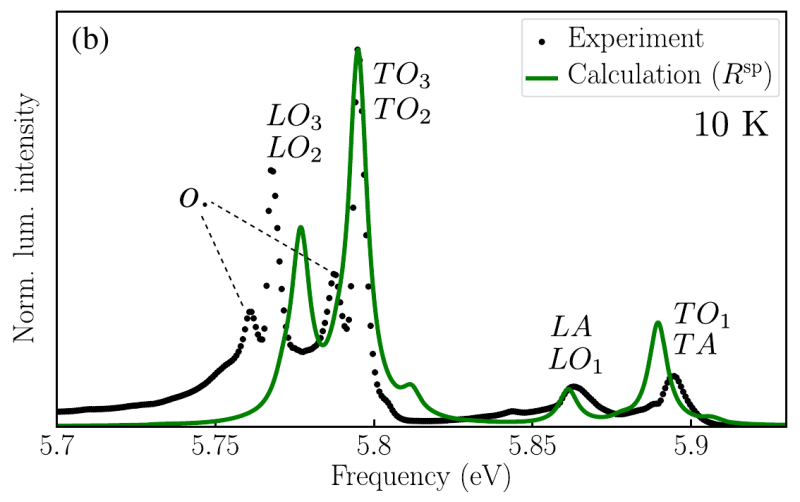
In the h-BN example shown here, the Texc was obtained from experimental measurements, only the lowest two excitons were included in the sum and the Bose function was replaced by a Boltzmann distribution with the energy zero fixed at the lowest excitonic energy. An appropriate scissor operator independent of the atomic displacements was added in the calculation. The final result is shown in the figure above and compared with the experimental measurement at 10 Kelvin
Some additional considerations on luminescence calculations
- In general due to the Bose (or Boltzmann) factor only the lower excitons (often only the lowest one) contribute to the luminescence signal
- The lowest excitons are degenerate all of them have to be included in the sum, as in the h-BN example
- In the present formulation of luminescence spectra excitons are treated as Bosons (or Boltzman particles), in principle it is possible to define a excitonic occupation starting from a quasi-equilibrium distribution of excited electron-hole, but this requires a rotation of the electron-hole occupations in the excitonic base for a discussion see Ref.[1][4]
- In order to speed up calculations you can perform all calculations without symmetries and copy the dielectric constant (ndb.em1s* or ndb.pp* files) from the undistorted supercell to the displaced ones. In this case, if you do not need to calculate GW correction, for example using a scissor, you can also reduce the number of bands in the non-self-consistent calculation to the one required by the BSE, for a discussion see Ref[3]
- Notice that the dipole matrix elements that will enter in optical absorption and luminescence depend form the direction of the electric field. In this example shown before the luminescence has been averaged in x and y directions because we were interested in the in-place luminescence. In general is it possible to select specific directions to reproduce particular experimental setups[1][2].
Some example input files for h-BN
In this section, I will provide some input files to repeat calculations in h-BN. Luminescence spectra were calculated using a 12x12x4 k-point grid and 200 bands for the dielectric constant in the primitive cell and 3000 mHa block size. In the supercell used to generate the luminescence spectra, there are 24 atoms, this means that the total number of bands has to be increased to 1200 and the corresponding k-point sampling reduced approximately to 12x2x4, this is automatically done by the Yambopy. Here are the input files:
- Primitive cell SCF and NSCF files and inputs for phonon calculations: hBN_scf_nscf_phonons.tgz
- The Q=(1/3,1/6,0) phonon mode generated by matdyn.x: Q_mode.tgz
- The non-diagonal supercells for SCF and NSCF calculations (without symmetries) and the Yambo file for the BSE BSE_supercell.tgz
- The displaced supercells for exciton-phonon calculations Displaced_Cells.tgz
You can the same BSE input file in all the displaced supercells.
If you did not use symmetries, you can avoid recalculating the dielectric constant by copying the SAVE/ndb.em1s* files from the undistributed supercell to the displaced ones.
References
- ↑ 1.0 1.1 1.2 1.3 1.4 Theory of phonon-assisted luminescence in solids: Application to hexagonal boron nitride, E. Cannuccia, B. Monserrat and C. Attaccalite, Phys. Rev. B 99, 081109(R) (2019)
- ↑ 2.0 2.1 2.2 2.3 2.4 2.5 2.6 2.7 Exciton-Phonon Coupling in the Ultraviolet Absorption and Emission Spectra of Bulk Hexagonal Boron Nitride, F. Paleari et al. PRL 122, 187401(2019)
- ↑ 3.0 3.1 3.2 3.3 Excitons under strain: light absorption and emission in strained hexagonal boron nitride, P. Lechifflart, F. Paleari and C. Attaccalite, SciPost Phys. 12, 145(2022).
- ↑ 4.0 4.1 Phonon-Assisted Luminescence in Defect Centers from Many-Body Perturbation Theory, F. Libbi, P. M. M. C. de Melo, Z. Zanolli, M. J. Verstraete, and N. Marzari, Phys. Rev. Lett. 128, 167401 (2022)
- ↑ Pressure dependence of electronic, vibrational and optical properties of wurtzite-boron nitride, M. Silvetti, C. Attaccalite, E. Cannuccia, Physical Review Materials 7, 055201 (2023)
- ↑ Electron-phonon coupling from finite differences, Bartomeu Monserrat, J. Phys.: Condens. Matter 30 083001(2018)
- ↑ Lattice dynamics and electron-phonon coupling calculations using nondiagonal supercells, J. H. Lloyd-Williams and B. Monserrat, Phys. Rev. B 92, 184301(2015)


